Spring constant "k" lab
Purpose:
To determine the spring constant of three different springs varied in size from small, medium and large.
aBSTRACT:
In a relaxed state, with no force applied to it, a spring remains at rest. Suppose the spring was pulled with a force, Fpull, causing the spring to stretch to the right. When stretched, the spring exerts a force, Fspring, to the left. If you push on the spring with a force, Fpush, it compresses to the left. When compressed, the spring exerts a force, Fspring, to the right. In both cases, Fspring, is called the restorative force because it restores the spring back to its original length.
The amount of force exerted by a spring is proportional to the spring’s displacement; this is known as Hooke’s Law.
Fx = -kΔx
In this equation, Fx, is the force (measured in Newtons) exerted by the spring by a stretch, and Δx (measured in meters) is the displacement of the spring from its original, equilibrium position. The constant of proportionality, or the stiffness of the spring, is called the spring constant and it is expressed as the variable, k. Spring that have a larger value for k require more force to extend or compress them which is measured by the Δx. Springs that stretch easier have a smaller k value and that is apparent in the Δx. An essential feature to Hooke’s law is that the direction of the spring force is opposite to the direction of displacement from the original, equilibrium spring. If Δx is upward, then Fx is downward. If Δx is downward, then fx is upward.
In this lab, a mass, m, is attached to the lower end of a spring suspended from an apparatus. This causes the spring to stretch from its original, equilibrium position, a distance, d, to a new position under the influence of a load from the mass. According to Hooke’s law, the direction of the force is opposite to the direction of displacement of the spring; the direction of force is upward whereas the direction for the displacement of the spring is downward. The force applied by the spring must balance the upward restoring force of the spring and thus can be calculated using the equation:
M*g (mass x gravity)
The displacement of the spring can be calculated using the following equation:
D = xi – xf
The values can than be inserted into Microsoft Excel, producing a line graph. The slope of the line graph produced is the k value of the spring. The k value is measured in N/m (Newtons/meter).
Materials:
- 3 different springs with variable sizes (small, medium, and large)
- Apparatus stand
- One rod that fits into the apparatus stand
- Clamp
- Ruler
- Masses that vary in weight
- Computer with Microsoft Excel
Procedure:
- First, took the rod and insert it into the apparatus stand
- Second, used a rotating clamp to screw one end of the clamp onto the top of the rod and clamped the other end of the clamp onto the ruler. The ruler and rod stayed standing fairly parallel to one another
- It was helpful to have the clamp clamped onto the ruler at a whole value because that was the xi value each spring test begun from
- Third, the spring being tested was hung from the space between the rod and the ruler
- Fourth, at the end of the spring was a hook (which may need to be attached to the spring depending on the spring being used) which the mass could freely hang from
- Then, the equilibrium measurement of the spring was taken, which is how far down the ruler the bottom of the spring was at rest
- Next, a mass, m, was latched onto the hook and the spring elongated a specific distance, d
- Mass, m, in kilograms was recorded onto a spreadsheet and so was the distance the spring elongated following the addition of the mass, d, in meters
- Experiment was repeated five times for every spring. Each trial consisted of a different mass
- Finally, all data was imported onto a spreadsheet in Microsoft Excel and was graphed. A k value was then recorded using by looking at the slope of the line graphed.
Observation/rESULTS:
|
|
|
|
|
|
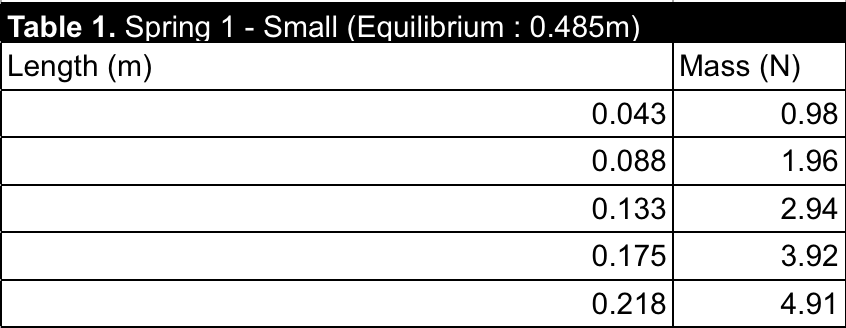
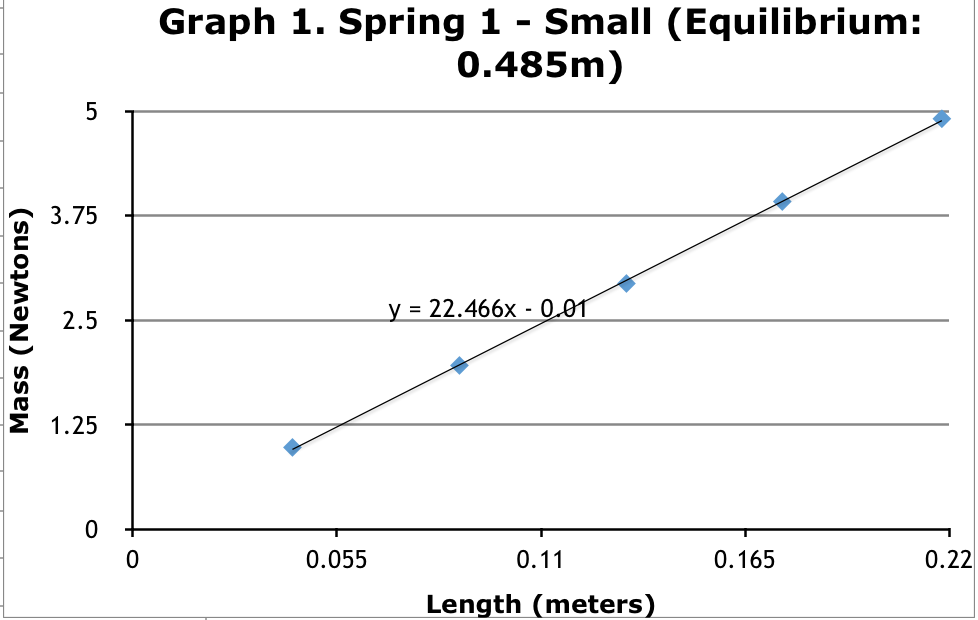
According to the tables made by excel, the mass in newtons for each weight remained the same. According to Graph 1, the smallest weight was measured to be 0.98N while the largest weight was measured being 4.91N. The equilibrium measured for the small spring was 0.485 meters. The farthest stretch experienced by the spring was 0.218 meters. Using the change in x, measured in meters, and the mass of each weight hung from the bottom of the small spring, measured in newtons, we were able to input the data into a spreadsheet graph our values and come up with the appropriate k value for the spring. By setting a linear trend line for the points plotting on the graph, the slope of set line gave us the k value. The k value for the smallest spring was about 22 N/m.
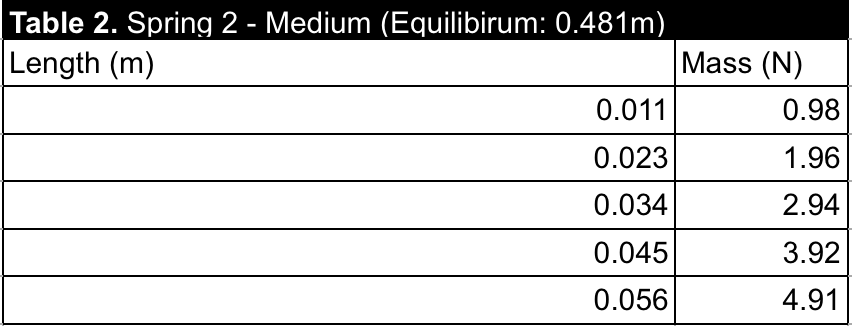
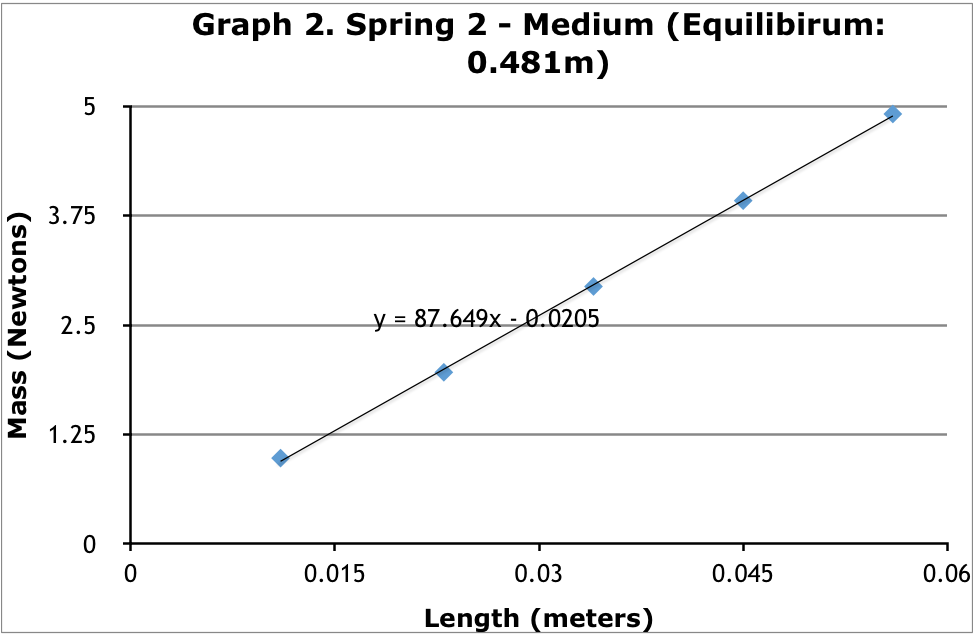
According to Graph 2, the medium spring’s equilibrium point was 0.481 meters. Mass applied to the spring remained constant with the other two tests. With the first weight attached to the spring, the spring stretched down 0.011 meters. With the final weight attached to the spring, the spring stretched down 0.056 meters. Again, using the values measured and recorded, the data was input into the spreadsheet and a scatter plot graph with the appropriate trend line calculated the k value of the middle spring being approximately 87N.
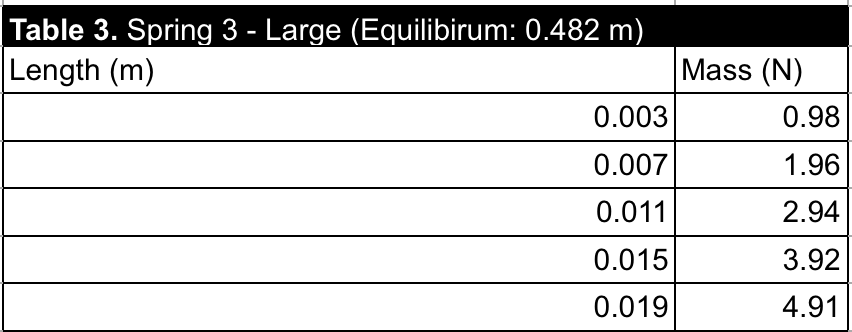
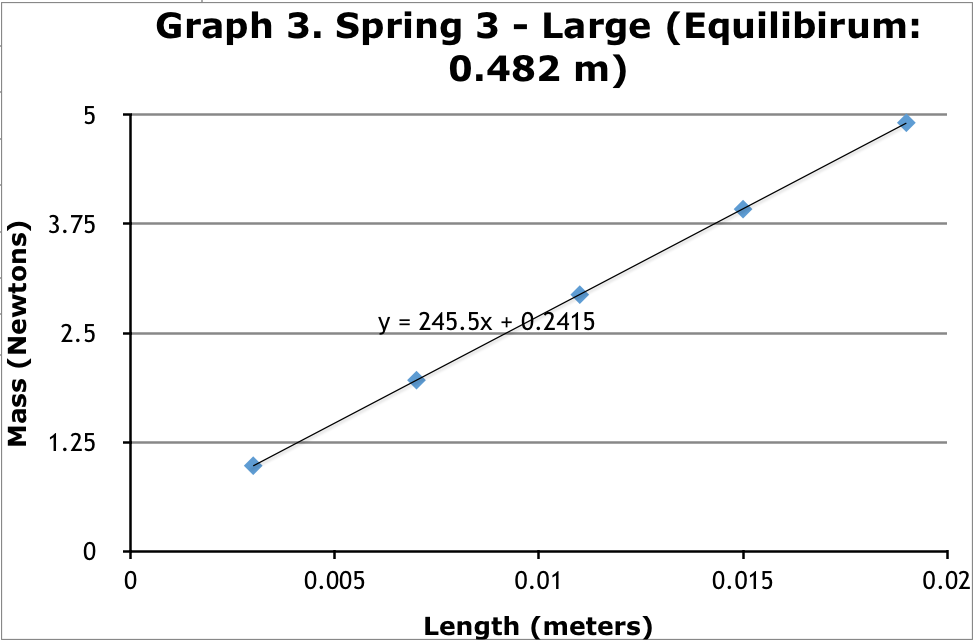
According to Graph 3, the large spring’s equilibrium point was 0.482 meters, not far off from the medium spring. With the first weight attached, measured at 0.98N, the spring stretched downward an x value of 0.003 meters. By the final weight, measured at 4.91 N, the spring stretched down 0.019N. Using the slope of the trend line in the graph, the k value of the largest spring came out to being about 245N.
According to Graph 2, the medium spring’s equilibrium point was 0.481 meters. Mass applied to the spring remained constant with the other two tests. With the first weight attached to the spring, the spring stretched down 0.011 meters. With the final weight attached to the spring, the spring stretched down 0.056 meters. Again, using the values measured and recorded, the data was input into the spreadsheet and a scatter plot graph with the appropriate trend line calculated the k value of the middle spring being approximately 87N.
According to Graph 3, the large spring’s equilibrium point was 0.482 meters, not far off from the medium spring. With the first weight attached, measured at 0.98N, the spring stretched downward an x value of 0.003 meters. By the final weight, measured at 4.91 N, the spring stretched down 0.019N. Using the slope of the trend line in the graph, the k value of the largest spring came out to being about 245N.
Analysis/Conclusions:
The general trend of our data was like we expected. The stiffer spring, in our experiment the large spring, the less change in x it will experience as a weight of certain magnitude is added to the end of the spring. Because it experiences less stretch from equilibrium position, its k value is theoretically suppose to be greater than a spring that is less stiff. This was apparent in the results, as according to Tables 1, 2, and 3, the small spring, which was the least stiff, had the smallest k value. The medium spring, which was medium in stiffness, had a medium k value relative to the other two springs. And finally, the large spring, which was the most stiff, had the largest k value relative to the other springs.
Because the mass in newtons applied to each spring remained the same, the only factor that contributed to the k value experienced by each spring was the change in x value when the weight was hung from the spring. The larger the mass, the farther down the spring would stretch from its respective equilibrium position. The small spring, because it was less stiff, stretched a maximum of 0.2 meters according to Table 1, which is far greater than both the medium and large springs. This explains why the k value in the small spring was far less than the k value in the other two springs. Meanwhile, with the large spring, because it was a lot stiffer than the other two, with each weight added, the change in x was not as great. According to Table 3, the maximum stretch experienced by spring 3 was 0.019 meters which is about ten times as less the stretch experienced by the smallest spring. This explains why the k value of spring 3 was approximately ten times greater than the k value of spring 1; another proof to why the maximum change in x directly corresponded to the k value of each spring.
In conclusion, by measuring the stretch, also known as the change in x, of a spring, whether that spring may be stiff or not, by applying a weight of some mass to it, the k value of the spring can be calculated using a graph. The slope of the trend line associated with the points of the graph provides the k value. The k value for any spring can be calculated either by experiment, like what was done in this lab, and a graphing method, or by equation if the appropriate values are given or can be calculated with what is given.
Error Analysis:
There are a few errors that can occur in this lab that could significantly or slightly alter the k value of the springs that were calculated. The three errors include:
Second, if a spring is oscillating while a new mass is attached onto the end to calculate another value used to determine the k value, a proper reading of the change in x in the downward direction is not recorded. Because the mass was not hung from the spring, while at rest and at equilibrium, the data collected from that particular test can not be validated or reliable because the test results were different from the rest. This in turn forces error to occur in the final x value which is later used to determine k.
Third, when measuring change in x from the initial, equilibrium position to the final position, accurate measurements are needed in order to avoid error in the values for k. The more accurate the results, the better k value calculated. Also, because the graph that is used to calculate the value for k is weight (newtons) over distance (meters), any measurements taken of the spring being stretched down a value of x units by the weight must first be measured in centimeters and then converted into meters. If the conversion is not correct, this error causes changes to value of weight, which is measures as mass * gravity and distance, and weight measured in meters.
- The effectiveness of the spring itself; the older the spring, the more stretched out it was in equilibrium position which did not give a true Δx value
- Allowing the spring to level itself back to equilibrium before the next mass was added to calculate the Δx value
- Ensuring that when measuring Δx, the right value was recorded and converted from centimeters to meters
Second, if a spring is oscillating while a new mass is attached onto the end to calculate another value used to determine the k value, a proper reading of the change in x in the downward direction is not recorded. Because the mass was not hung from the spring, while at rest and at equilibrium, the data collected from that particular test can not be validated or reliable because the test results were different from the rest. This in turn forces error to occur in the final x value which is later used to determine k.
Third, when measuring change in x from the initial, equilibrium position to the final position, accurate measurements are needed in order to avoid error in the values for k. The more accurate the results, the better k value calculated. Also, because the graph that is used to calculate the value for k is weight (newtons) over distance (meters), any measurements taken of the spring being stretched down a value of x units by the weight must first be measured in centimeters and then converted into meters. If the conversion is not correct, this error causes changes to value of weight, which is measures as mass * gravity and distance, and weight measured in meters.
